Проекции и координатни системи
Преглед
Точното изобразяване на повърхността на сфера върху плосък лист хартия е невъзможна геометрична задача, която винаги води до някакъв вид деформация на изобразените обекти. Картните проекции са техниките, с които изобразяваме повърхността на Земята от оригиналната ѝ сферична форма върху плоскост, било то лист хартия или компютърен екран.
Координатната система (КС) или още координатна референтна система дефинира математическите правила как двуизмерните обекти от проектираната карта се отнасят към реалните обекти на повърхността на Земята.
Решението коя картна проекция и коя КС да използваме зависи от пространствения обхват, методите за анализ и посланието, което се опитваме да предадем с картата на дадена територия.
Картната проекция в детайли
Най-точния метод да изобразим земната форма и повърхност е като използваме глобус, но за съжаление той не се събира лесно в джоба на дънките и го прави практически неприложим в повечето случаи. Освен това глобусите не позволяват представянето на земни площи в по-едър мащаб от 1:10 000 000.
Повечето данни в ГИС са в много по-едър мащаб в зависимост от степенна на детайлност. Мащаби от порядъка на 1:250 000 или дори 1:5000 в градска среда са нормална практика. Глобус с подобен мащаб ще бъде абсурдно голям, труден за съхранение, скъп за производство и крайно неудобен за транспортиране. Именно затова картографите използват редица техники, наречени картните проекции, които с голяма точност да пресъздават сферичната повърхност на Земята в двуизмерна равнина.
Сревнена с човешките мащаби, Земята е огромна. Именно затова от нашата гледна точка, повърхността ѝ изглежда плоска. Погледната от Космоса обаче е очевидно, че планетата ни има кълбовидна форма.
Картите са създадени да комуникират по визуален начин разположението, формата и описанието на обектите по земната повърхност.
When viewed at close range the earth appears to be relatively flat. However when viewed from space, we can see that the earth is relatively spherical. Maps, as we will see in the upcoming map production topic, are representations of reality. They are designed to not only represent features, but also their shape and spatial arrangement. Each map projection has advantages and disadvantages. The best projection for a map depends on the scale of the map, and on the purposes for which it will be used. For example, a projection may have unacceptable distortions if used to map the entire African continent, but may be an excellent choice for a large-scale (detailed) map of your country. The properties of a map projection may also influence some of the design features of the map. Some projections are good for small areas, some are good for mapping areas with a large East-West extent, and some are better for mapping areas with a large North-South extent.
Трите вида картни проекции
Да си представим, че Земята е прозрачна сфера (като топка за коледна украса), в центъра на която сме поставили източник на светлина, а по повърхността сме изрисували континентите с непрозрачна боя. Ако направим това в тъмна стая, срещу плосък лист хартия, то ще видим сенките на континентите, т.е. тяхната проекция. Има различни начини за поставяне на хартията като цилиндър, конус или плоскост. Всеки от тези начини за проектиране на повърхността на сферата се нарича вид на картната проекция. Поради тази причина можем да говорим за цилиндрични проекции, конусни и азимутални проекции.
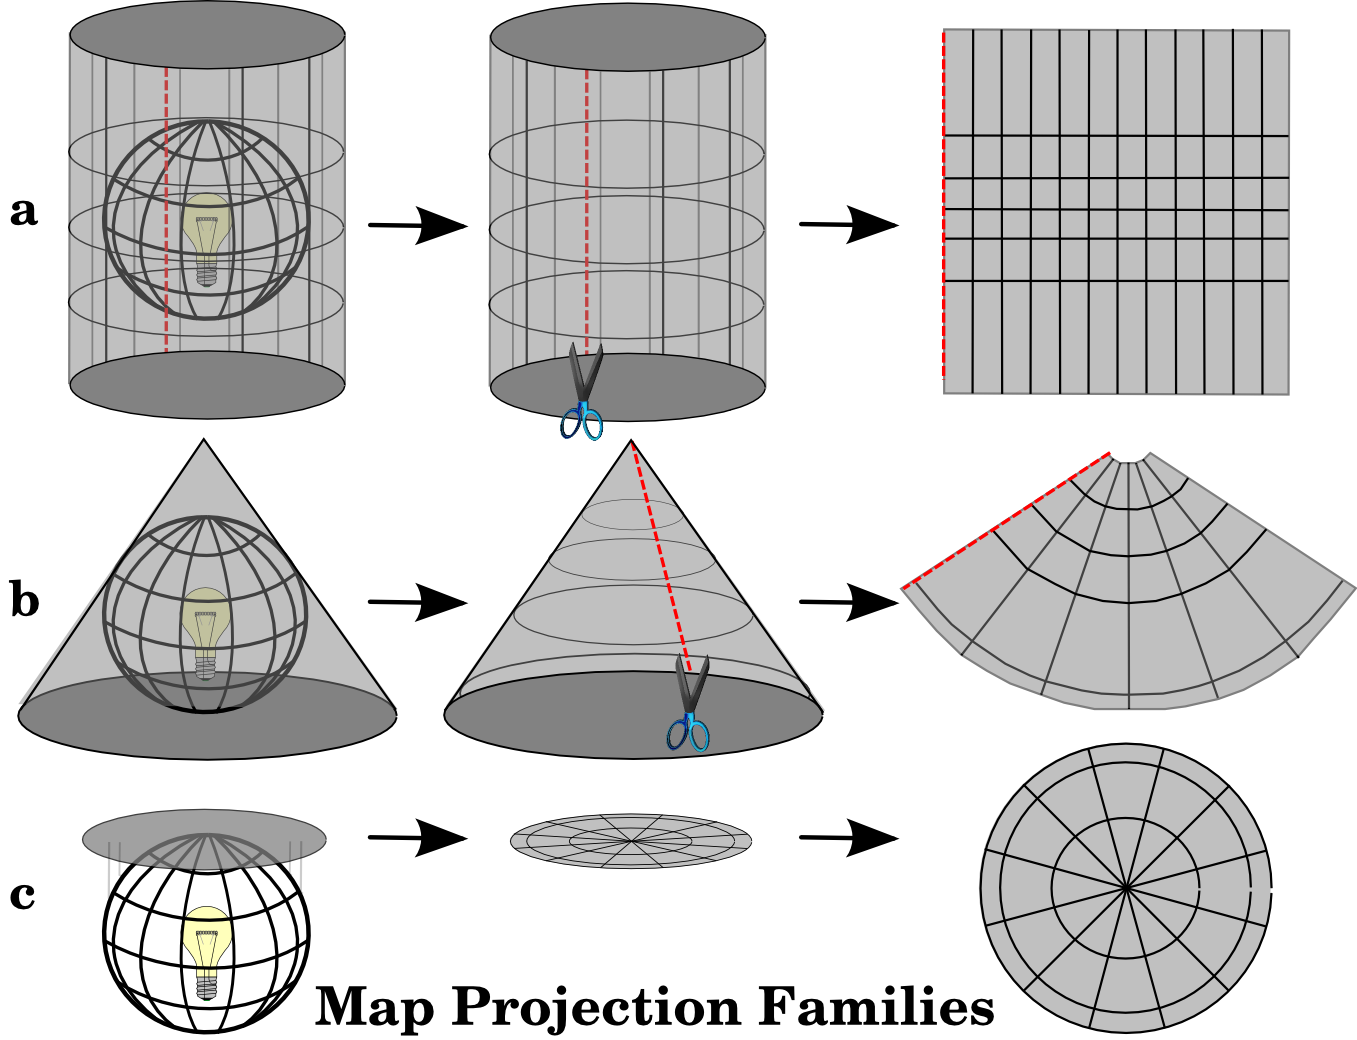
Метафората с проздрачната сфера и лампичка по средата естествено е неприложима в реалността. За целта се използват математически принципи, заимствани от геометрията и тригонометрията.
Точност на картните проекции
Картните проекции никога не са абсолютно точно представяне на повърхността на сферичната ни планета. Поради тази причина всяка карта страда от деформации на разстоянията между обектите на повърхността на Земята, техните площи и ъглите между тях. Всяка картна проекция страда от една или повече от тези деформации в по-малка или по-голяма степен. Именно заради това съществуват различни картни проекции, като ролята на ГИС специалиста е да изберат правилната проекция за даденото приложение на картата.
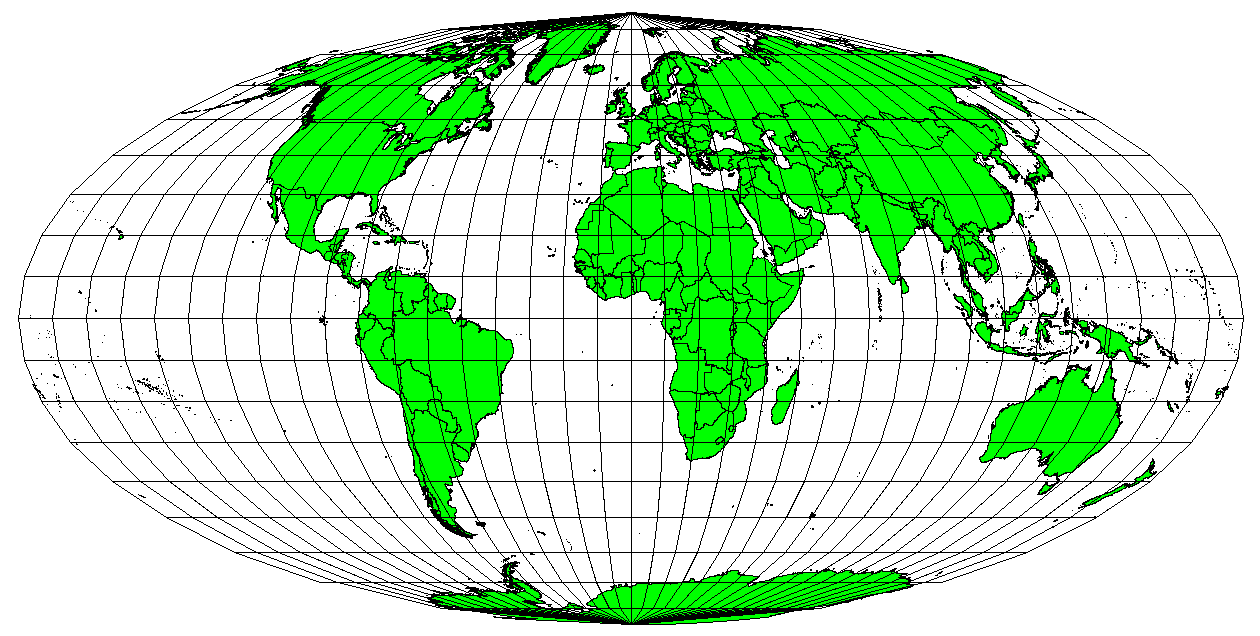
Например проекцията на Робинсон, както и тази на Винкел Трипел често се използват при световни карти.
Ако искаме да направим анализ на транспортните връзки, добра идея е да се използва проекция, която има малки деформации на разстоянията.
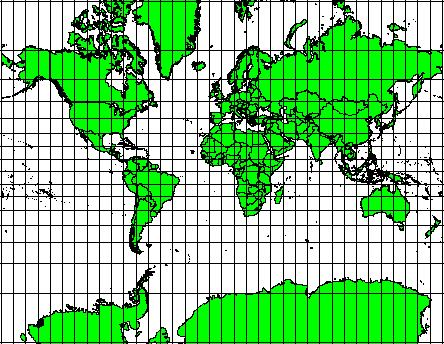
Конформни картни проекции
When working with a globe, the main directions of the compass rose (North, East, South and West) will always occur at 90 degrees to one another. In other words, East will always occur at a 90 degree angle to North. Maintaining correct angular properties can be preserved on a map projection as well. A map projection that retains this property of angular conformity is called a conformal or orthomorphic projection.
These projections are used when the preservation of angular
relationships is important. They are commonly used for navigational or
meteorological tasks. It is important to remember that maintaining true
angles on a map is difficult for large areas and should be attempted
only for small portions of the earth. The conformal type of projection
results in distortions of areas, meaning that if area measurements are
made on the map, they will be incorrect. The larger the area the less
accurate the area measurements will be. Examples are the Mercator
projection (as shown in figure_mercator_projection{.interpreted-text
role=”numref”}) and the Lambert Conformal Conic projection. The U.S.
Geological Survey uses a conformal projection for many of its
topographic maps.
::: {#figure_mercator_projection}
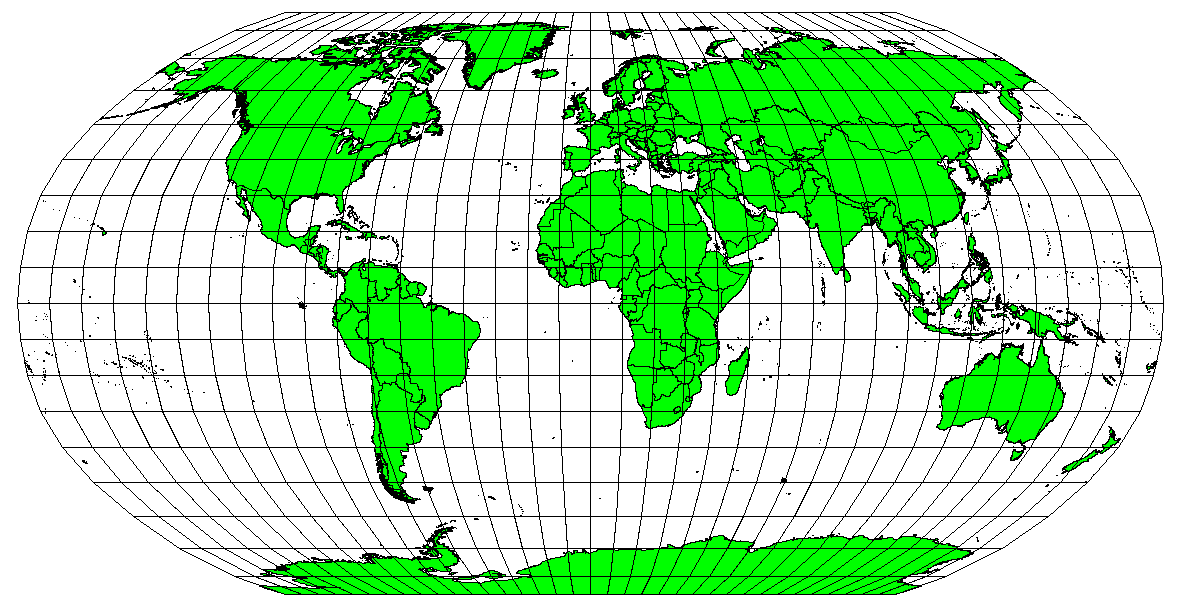
Еквидистантни проекции
If your goal in projecting a map is to accurately measure distances, you
should select a projection that is designed to preserve distances well.
Such projections, called equidistant projections, require that the
scale of the map is kept constant. A map is equidistant when it
correctly represents distances from the centre of the projection to any
other place on the map. Equidistant projections maintain accurate
distances from the centre of the projection or along given lines. These
projections are used for radio and seismic mapping, and for navigation.
The Plate Carree Equidistant Cylindrical (see
figure_plate_caree_projection) and
the Equirectangular projection are two good examples of equidistant
projections. The Azimuthal Equidistant projection is the projection
used for the emblem of the United Nations (see
figure_azimuthal_equidistant_projection{.interpreted-text
role=”numref”}).
::: {#figure_plate_caree_projection}
::: {#figure_azimuthal_equidistant_projection}

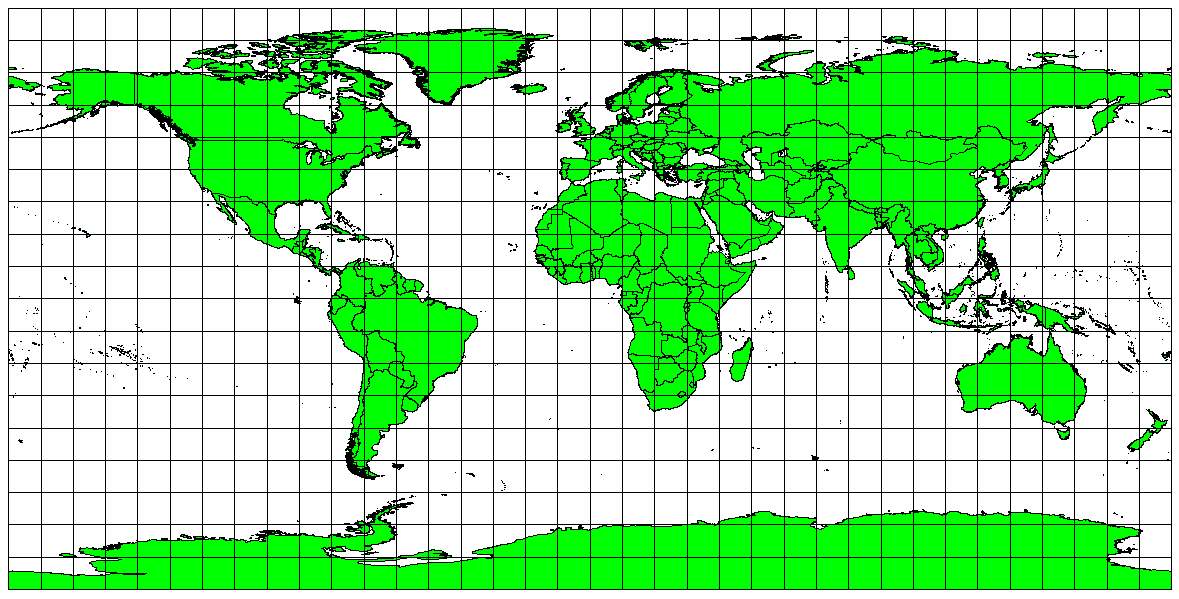
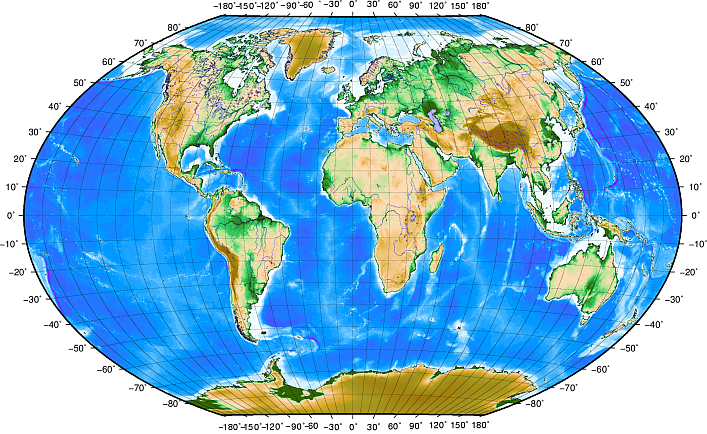
Равноплощни проекции
When a map portrays areas over the entire map, so that all mapped areas
have the same proportional relationship to the areas on the Earth that
they represent, the map is an equal area map. In practice, general
reference and educational maps most often require the use of equal
area projections. As the name implies, these maps are best used when
calculations of area are the dominant calculations you will perform. If,
for example, you are trying to analyse a particular area in your town to
find out whether it is large enough for a new shopping mall, equal area
projections are the best choice. On the one hand, the larger the area
you are analysing, the more precise your area measures will be, if you
use an equal area projection rather than another type. On the other
hand, an equal area projection results in distortions of angular
conformity when dealing with large areas. Small areas will be far less
prone to having their angles distorted when you use an equal area
projection. Alber's equal area, Lambert's equal area and
Mollweide Equal Area Cylindrical projections (shown in
figure_mollweide_equal_area_projection{.interpreted-text
role=”numref”}) are types of equal area projections that are often
encountered in GIS work.
::: {#figure_mollweide_equal_area_projection}
Keep in mind that map projection is a very complex topic. There are hundreds of different projections available world wide each trying to portray a certain portion of the earth's surface as faithfully as possible on a flat piece of paper. In reality, the choice of which projection to use, will often be made for you. Most countries have commonly used projections and when data is exchanged people will follow the national trend.
Още за координатните реферетни системи
С помощта на координатните реферетни системи (на англ. Coordinate Reference Systems - CRS) всяка точка на Земята може да се опише с три числа, които се наричат координати. Има два основни вида координатни реферетни системи:географски координатни системи и правоъгълни/проекционни/Декартови координатни системи.
Географски координатни системи
Употребата на географски координнатни реферетни системи е честа практика в ГИС. Това е координатната система, която повече хора асоциират още от училище, когато чуят “географски координати”. За описването на местоположение на точка се използват градуси за географска ширина и дължина. Най-често срещаната географска координатна система е WGS 84.
Lines of latitude run parallel to the equator and divide the earth
into 180 equally spaced sections from North to South (or South to
North). The reference line for latitude is the equator and each
hemisphere is divided into ninety sections, each representing one
degree of latitude. In the northern hemisphere, degrees of latitude are
measured from zero at the equator to ninety at the north pole. In the
southern hemisphere, degrees of latitude are measured from zero at the
equator to ninety degrees at the south pole. To simplify the
digitisation of maps, degrees of latitude in the southern hemisphere are
often assigned negative values (0 to -90°). Wherever you are on the
earth’s surface, the distance between the lines of latitude is the same
(60 nautical miles). See figure_geographic_crs{.interpreted-text
role=”numref”} for a pictorial view.
::: {#figure_geographic_crs}
Lines of longitude, on the other hand, do not stand up so well to
the standard of uniformity. Lines of longitude run perpendicular to the
equator and converge at the poles. The reference line for longitude (the
prime meridian) runs from the North pole to the South pole through
Greenwich, England. Subsequent lines of longitude are measured from zero
to 180 degrees East or West of the prime meridian. Note that values West
of the prime meridian are assigned negative values for use in digital
mapping applications. See figure_geographic_crs{.interpreted-text
role=”numref”} for a pictorial view.
At the equator, and only at the equator, the distance represented by one line of longitude is equal to the distance represented by one degree of latitude. As you move towards the poles, the distance between lines of longitude becomes progressively less, until, at the exact location of the pole, all 360° of longitude are represented by a single point that you could put your finger on (you probably would want to wear gloves though). Using the geographic coordinate system, we have a grid of lines dividing the earth into squares that cover approximately 12363.365 square kilometres at the equator --- a good start, but not very useful for determining the location of anything within that square.
To be truly useful, a map grid must be divided into small enough
sections so that they can be used to describe (with an acceptable level
of accuracy) the location of a point on the map. To accomplish this,
degrees are divided into minutes (') and seconds ("). There
are sixty minutes in a degree, and sixty seconds in a minute (3600
seconds in a degree). So, at the equator, one second of latitude or
longitude = 30.87624 meters.
Правоъгълни координатни системи
Правоъгълните координатни системи, наричани още проекционни или Декартови, са най-често използваните при анализи в ГИС.
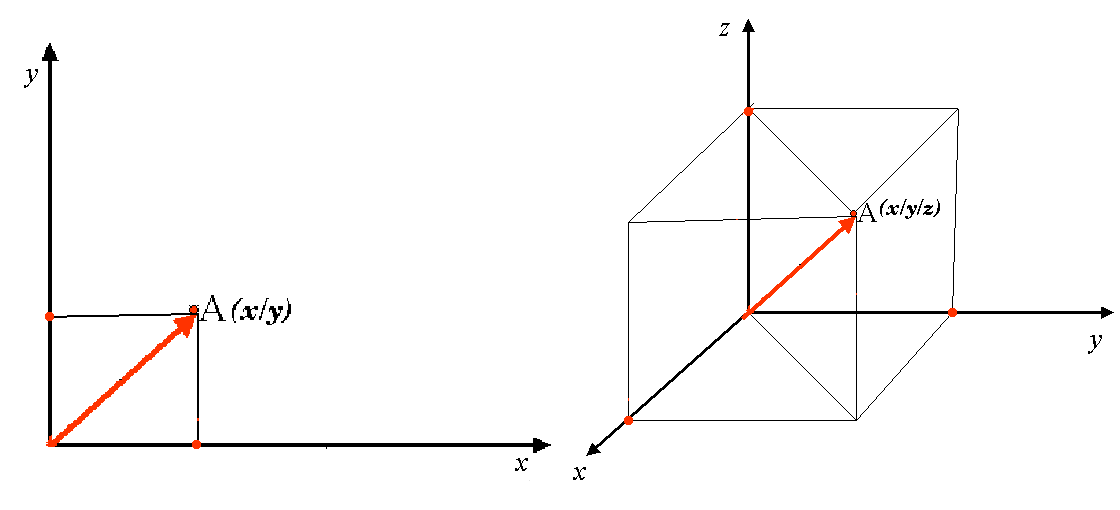
Още от училище знаем, че простраственото положение на точка в двуизмерна координатна система се определя от стойността на координатите по двете оси на координатната система - X и Y. Двете оси се пресичат под прав ъгъл и образуват равнина. Обикновено хоризонтална ос се означава с X, а вертикалната с Y. Колкото “по-надясно” е дадена точка, толкова повече се увеличава стойността по X, както и колкото “по-нагоре”, толкова по-голяма е стойността за Y.
Понякога в ГИС използваме и трета ос Z, която е взаимно перпендикулярна на X и Y и измерва височината на обектите. Всяка точка със сферични координати може да се бъде изразена с X Y Z координати.
Проекционна координатна система в северното или южното полукълбо обикновено използва точка на Екватора върху определен меридиан като специфична дължина. За северното полукълбо това означава, че стойностите по Y се увеличават на север и стойностите по X се увеличават на изток. В южното полукълбо е точно наобратно - стойностите по Y се увеличават на юг, а стойностите по X се увеличават на запад. Универсалната трансверзална меркаторова проекция (UTM) е де факто стандартната проекция използвана по света.
Универсална трансверзална меркаторорова(UTM) координатна система
Универсалната трансверзалта меркаторова (UTM) координатна рефертна система има за начало екватора на определена географска дължина. Стойностите по Y се увеличават на юг, а по X се увеличават на запад. UTM проекцията е глобална, т.е. се използва по целия свят. Но както вече обсъдихме в секцията Точност на картните проекции, при по-големи площи (например Европа), деформациите на ъглите, площите и разтоянията се увеличава. За да се избегнат подобни изкривявания, светът е разделен на 60 еднакви зони, всяка от които по 6 градуса широки по географска дължина. Всяка UTM зона си има номер от 1 до 60, започвайки от антимеридиана от запад на изток. По този начин UTM зона 1 започва на 180 градуса западна дължина, а UTM зона 60 приключва на 180 градуса западна дължина.
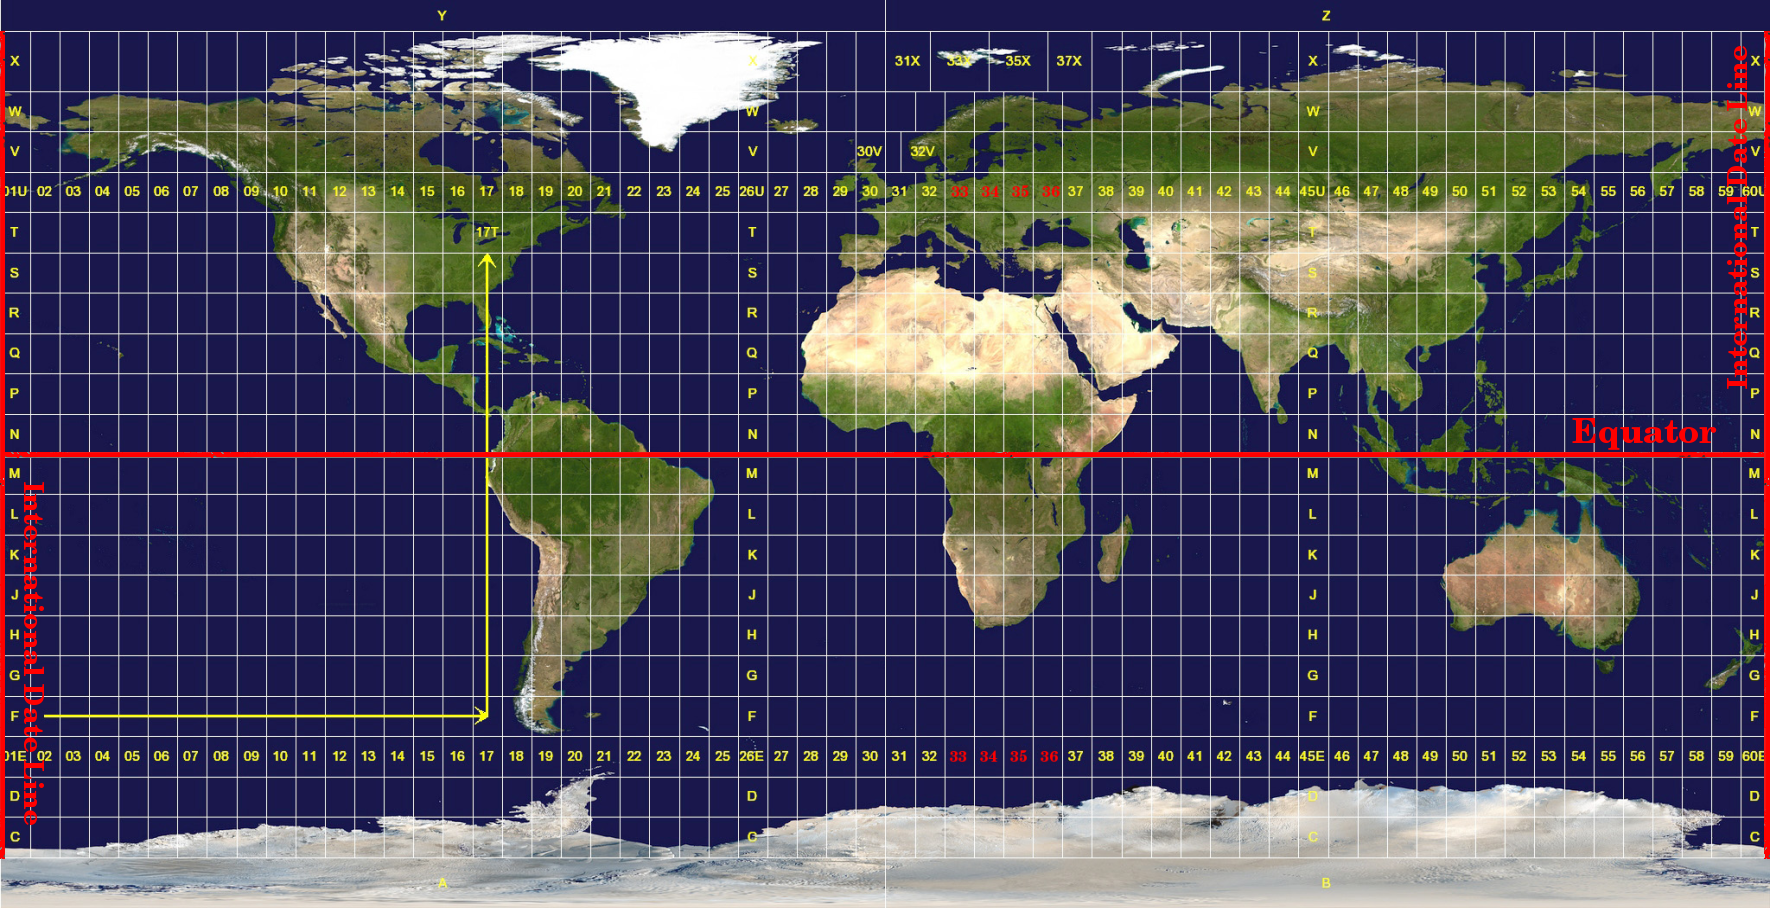
Площи с правоъгълна форма, която е издължена по паралела, какъвто е случаят на България, могат да попаднат в повече от една зона. Така нашата територия попада в зоните 34N (западната част до р. Искър) и 35N (от р. Искър до Черно море). При работа върху цялата територия на страната често се зона 35N като достатъчно добро приближение. Буквата N указва, че става дума за северното полукълбо, а буквата S се използва за площите южно от екватора.
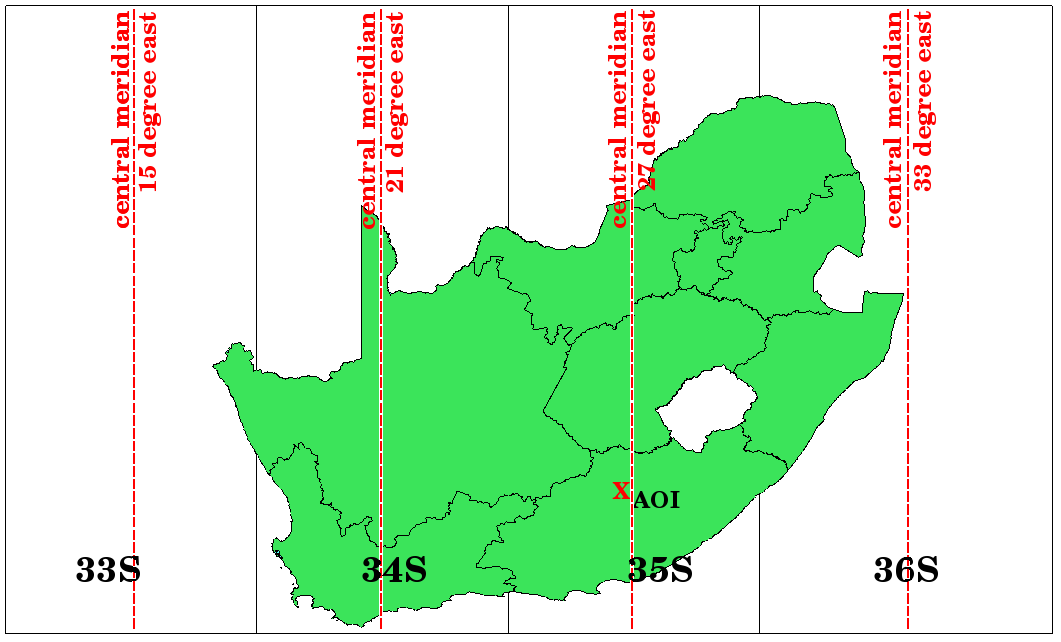
Say, for example, that we want to define a two-dimensional coordinate
within the Area of Interest (AOI) marked with a red cross in
figure_utm_for_sa. You can see, that
the area is located within the UTM zone 35S. This means, to minimize
distortion and to get accurate analysis results, we should use UTM
zone 35S as the coordinate reference system.
The position of a coordinate in UTM south of the equator must be
indicated with the zone number (35) and with its northing (Y)
value and easting (X) value in meters. The northing value is
the distance of the position from the equator in meters. The
easting value is the distance from the central meridian
(longitude) of the used UTM zone. For UTM zone 35S it is 27 degrees
East as shown in figure_utm_for_sa{.interpreted-text
role=”numref”}. Furthermore, because we are south of the equator and
negative values are not allowed in the UTM coordinate reference system,
we have to add a so called false northing value of 10,000,000 m to
the northing (Y) value and a false easting value of 500,000 m to the
easting (X) value. This sounds difficult, so, we will do an example that
shows you how to find the correct UTM 35S coordinate for the Area
of Interest.
The northing (Y) value
The place we are looking for is 3,550,000 meters south of the equator, so the northing (Y) value gets a negative sign and is -3,550,000 m. According to the UTM definitions we have to add a false northing value of 10,000,000 m. This means the northing (Y) value of our coordinate is 6,450,000 m (-3,550,000 m + 10,000,000 m).
The easting (X) value
First we have to find the central meridian (longitude) for the UTM
zone 35S. As we can see in figure_utm_for_sa{.interpreted-text
role=”numref”} it is 27 degrees East. The place we are looking for
is 85,000 meters West from the central meridian. Just like the
northing value, the easting (X) value gets a negative sign, giving a
result of -85,000 m. According to the UTM definitions we have to add
a false easting value of 500,000 m. This means the easting (X) value
of our coordinate is 415,000 m (-85,000 m + 500,000 m). Finally, we have
to add the zone number to the easting value to get the correct
value.
As a result, the coordinate for our Point of Interest, projected in UTM zone 35S would be written as: 35 415,000 m E / 6,450,000 m N. In some GIS, when the correct UTM zone 35S is defined and the units are set to meters within the system, the coordinate could also simply appear as 415,000 6,450,000.
On-The-Fly Projection
As you can probably imagine, there might be a situation where the data you want to use in a GIS are projected in different coordinate reference systems. For example, you might get a vector layer showing the boundaries of South Africa projected in UTM 35S and another vector layer with point information about rainfall provided in the geographic coordinate system WGS 84. In GIS these two vector layers are placed in totally different areas of the map window, because they have different projections.
To solve this problem, many GIS include a functionality called on-the-fly projection. It means, that you can define a certain projection when you start the GIS and all layers that you then load, no matter what coordinate reference system they have, will be automatically displayed in the projection you defined. This functionality allows you to overlay layers within the map window of your GIS, even though they may be in different reference systems. In QGIS, this functionality is applied by default.
Common problems / things to be aware of
The topic map projection is very complex and even professionals who have studied geography, geodetics or any other GIS related science, often have problems with the correct definition of map projections and coordinate reference systems. Usually when you work with GIS, you already have projected data to start with. In most cases these data will be projected in a certain CRS, so you don't have to create a new CRS or even re project the data from one CRS to another. That said, it is always useful to have an idea about what map projection and CRS means.
What have we learned?
Let's wrap up what we covered in this worksheet:
- Map projections portray the surface of the earth on a two-dimensional, flat piece of paper or computer screen.
- There are global map projections, but most map projections are created and optimized to project smaller areas of the earth's surface.
- Map projections are never absolutely accurate representations of the spherical earth. They show distortions of angular conformity, distance and area. It is impossible to preserve all these characteristics at the same time in a map projection.
- A Coordinate reference system (CRS) defines, with the help of coordinates, how the two-dimensional, projected map is related to real locations on the earth.
- There are two different types of coordinate reference systems: Geographic Coordinate Systems and Projected Coordinate Systems.
- On the Fly projection is a functionality in GIS that allows us to overlay layers, even if they are projected in different coordinate reference systems.
Now you try!
Here are some ideas for you to try with your learners:
- Start QGIS
- In
Project --> Properties... --> CRS{.interpreted-text role=”menuselection”} checkNo projection (or unknown/non-Earth projection){.interpreted-text role=”guilabel”} - Load two layers of the same area but with different projections
- Let your pupils find the coordinates of several places on the two layers. You can show them that it is not possible to overlay the two layers.
- Then define the coordinate reference system as Geographic/WGS 84
inside the
Project Propertiesdialog - Load the two layers of the same area again and let your pupils see how setting a CRS for the project (hence, enabling "on-the-fly" projection) works.
- You can open the
Project Properties{.interpreted-text role=”guilabel”} dialog in QGIS and show your pupils the many different Coordinate Reference Systems so they get an idea of the complexity of this topic. You can select different CRSs to display the same layer in different projections.
Something to think about
If you don't have a computer available, you can show your pupils the principles of the three map projection families. Get a globe and paper and demonstrate how cylindrical, conical and planar projections work in general. With the help of a transparency sheet you can draw a two-dimensional coordinate reference system showing X axes and Y axes. Then, let your pupils define coordinates (X and Y values) for different places.
Further reading
Books:
- Chang, Kang-Tsung (2006). Introduction to Geographic Information Systems. 3rd Edition. McGraw Hill. ISBN: 0070658986
- DeMers, Michael N. (2005). Fundamentals of Geographic Information Systems. 3rd Edition. Wiley. ISBN: 9814126195
- Galati, Stephen R. (2006): Geographic Information Systems Demystified. Artech House Inc. ISBN: 158053533X
Websites:
- https://foote.geography.uconn.edu/gcraft/notes/mapproj/mapproj_f.html
- http://geology.isu.edu/wapi/geostac/Field_Exercise/topomaps/index.htm
The QGIS User Guide also has more detailed information on working with map projections in QGIS.
What's next?
In the section that follows we will take a closer look at Map Production.